«  View All Posts

3 Top Metrics for Tracking Content Success (+ 2 Curveballs)

July 5th, 2022 | 5 min. read

By Eric Gerber

Ready to reach more customers? These marketing services help.
View Zoe's Services
 

A sponsored content article is a powerful branding tool. Brand recall is 59% higher for folks that read a spon-con article vs. those who viewed a traditional display ad, Forbes reports.

But measuring its effectiveness for your specific campaign can be tricky. After all, the goal isn't a slew of clicks or leads; it's building trust in your brand as an expert. But is it reaching a big enough audience? And are enough of them reading it? How can you be sure?

You're not alone in these worries, especially if you're new to this marketing tactic. Here at Zoe Marketing & Communications, we've run thousands of these campaigns for businesses like you. And, for each one, we dig into the data and report the metrics that matter most.

In this blog, we'll unearth some of these insightful metrics as we explore:

Heads up: You can find all this data in the "Behavior" section of your Google Analytics (which you must sync to your website first!). Ready to make sense of sponsored content's subtle strength? Let's take a closer look at those eyeballs on your page.

Ready to Reach More Customers?

Connect with your best prospects — and drive more conversions — with a custom mix of digital ads, content, email, streaming ads, SEO, creative services and more.

View Zoe's Services

1. How many views did my article get?

First thing first: There are two types of "views" your article accumulates.

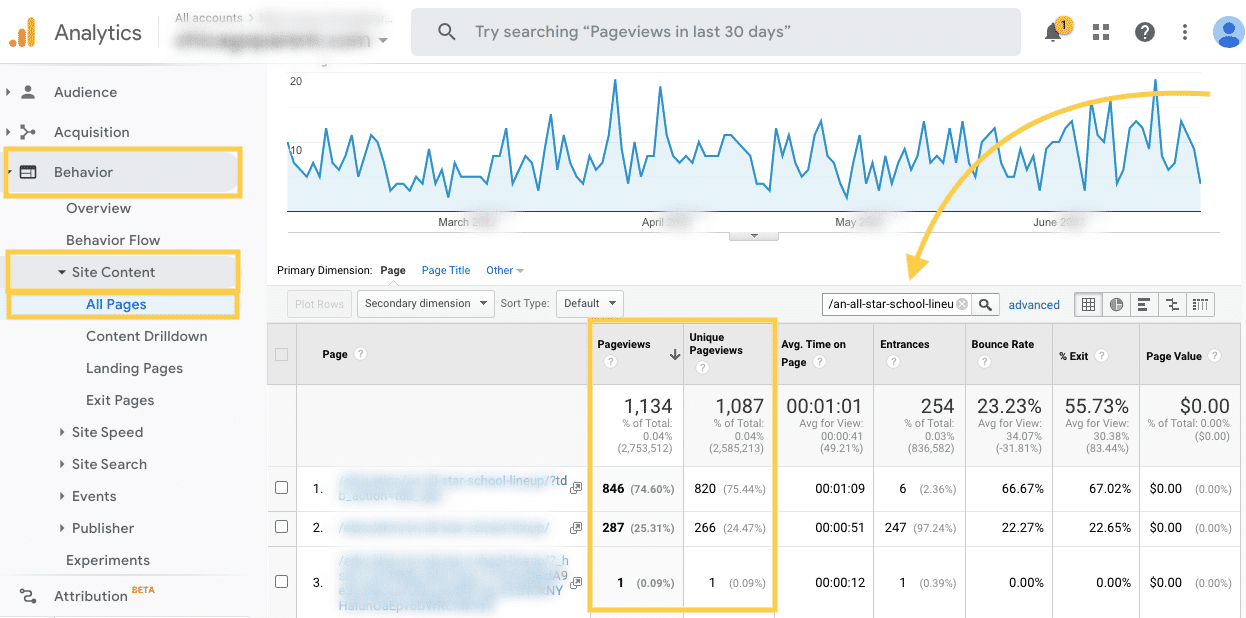
Both paint a vital piece of information. To access them, in Google Analytics, go to "Behavior," "Site Content" and "All Pages." Type the "slug" of your url — this is the name of the article with hyphens included, or everything after the final slash — into the search bar. You'll see something like this:

1 Google Analytics Page Views

Total views

This is the sheer volume of pageviews. So, every time a page loads, reloads or is revisited in a browser, that registers as one new "view."

The reason it matters? This is a pure volume metric. Your article drew this many total visits. That can be a clue about a headline that grabbed attention or top-notch SEO. At Zoe, our campaigns see 1,000-2,000 views monthly, and viral articles can get up to 5,000. Over time, you'll understand what's typical for your business.

Unique views

This drills down to the number of people doing the total views. Some looked at the page more than once, but here, that doesn't count. Naturally, this number is always smaller than total views — with spon-con at Zoe, it's about 5%-10% less.

That means not only was your article compelling the first time, but some folks went back once, twice, three times — or more. They're doing some homework. Your brand is resonating with them, building trust and doing what it's supposed to do.

2. How much time did people spend on my article?

Did these viewers stick around long enough to read what was on that page? That's an important distinction. 

Time spent on page

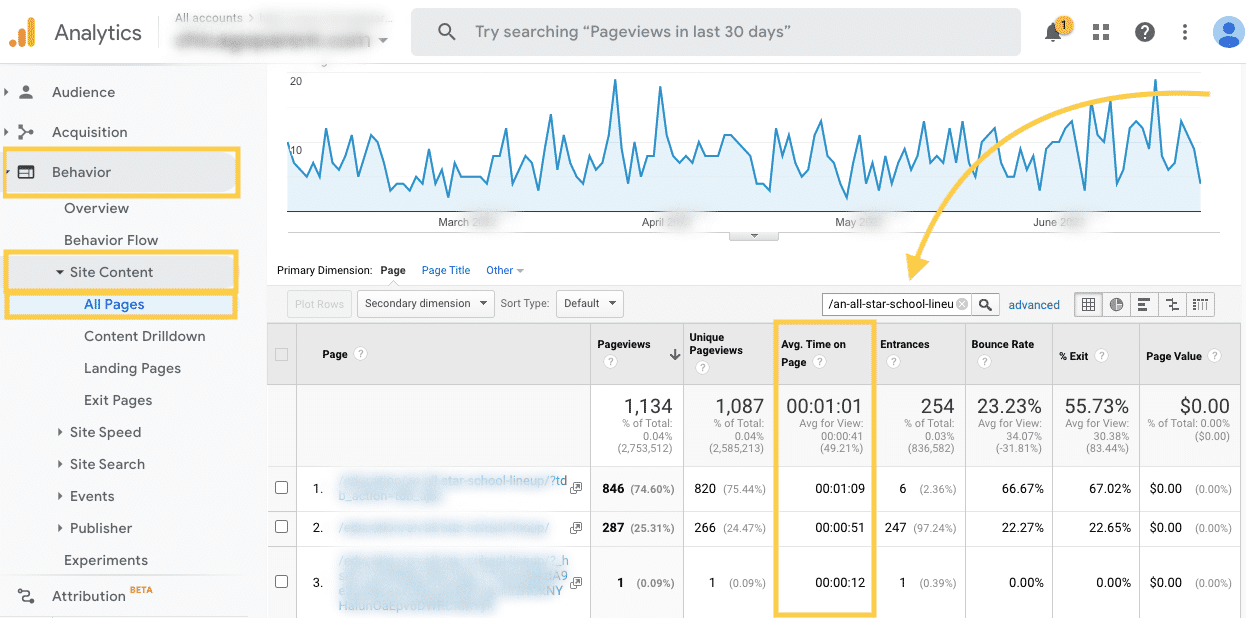
This is a basic stat you can also find in Google Analytics. It's right next to that pageview data, in a column called "Avg. Time on Page":

2 Google Analytics Time on Page

How can you tell if someone's read your entire article? Simple division. The average reader takes in about 200 words per minute. So, if you have an 800-word article, divide it by 200 — and you'll get the number of minutes. In this case, it would take 4 minutes to read.

(Hint: Instead of mathing, you can also use this handy Read-O-Meter website. Just copy in your article's body copy and click "Estimate Total Reading Time!")

When you pinpoint the analytics for your article, compare the average "time spent on page" to the time it would have taken to read your article. The closer the numbers, the more likely people stuck around to read your entire article. And that's a significant engagement/success metric.

Scroll depth tracking

This gets more granular. If you want to know how deep into your article folks actually got — how far down they scrolled — sync your site with Google Tag Manager. It takes some setup (see this post for the 101), but you can see how many got 25%, 50%, 75% or 100% into your article.

A word of caution: Some people skim to the bottom of an article to read the recap. There's a chance a "100%" doesn't mean they've read it all. Depth can be a useful secondary metric, though, to support "time spent on page" (and see where you can make improvements).

(Tip: You can also determine depth — even more specifically — if you use an ad manager to track your branded content articles, such as Broadstreet.)

3. Where is traffic to my article coming from?

"The source" is the third and final key metric. After all, all those eyeballs came from somewhere. And here, yet again, Google Analytics makes it plain.

Referrers

See which other websites "referred" traffic to your article — in other words, someone clicked a link on a site that sent them to you. These sources can include, but aren't limited to:

  • Google (paid or organic)

  • Email

  • Facebook/Instagram (paid or organic)

  • LinkedIn, Twitter, Pinterest and other social media (paid or organic)

  • Your website

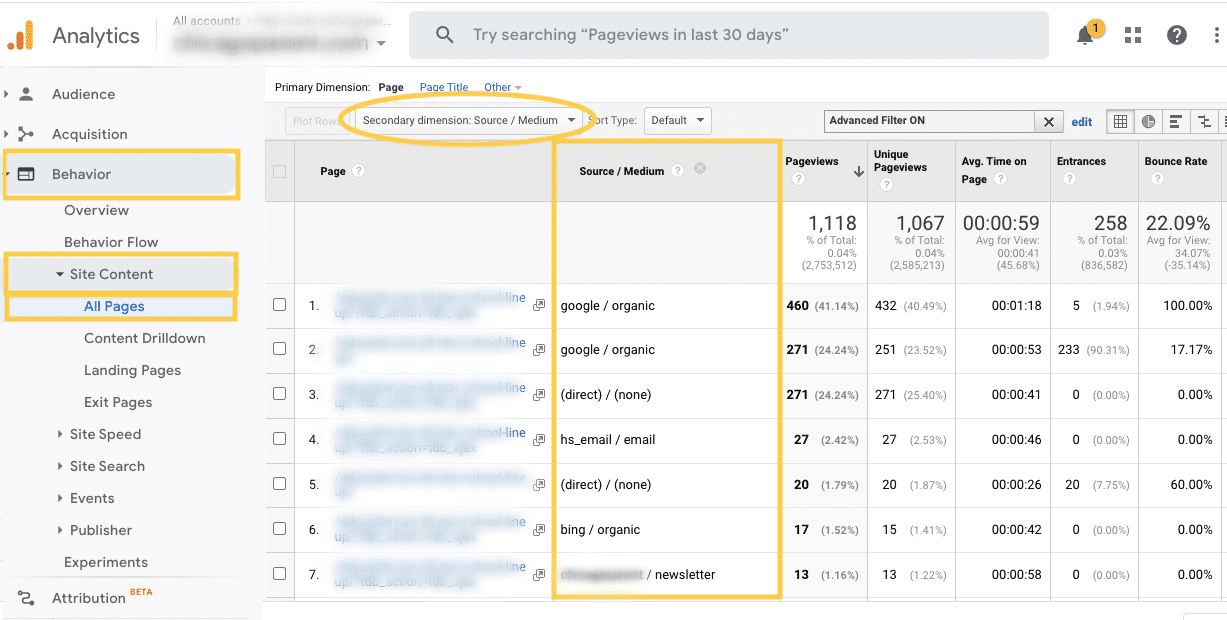
Find this data in the same Google Analytics section as "views" and "time on page." This time, though, in the "Secondary Dimensions" dropdown, type in/select "Source/Medium" to pull up this:

3 Google Analytics Source Medium

Looking at the results, you'll get a clear sense of which sources drove the highest traffic and success.

Geography

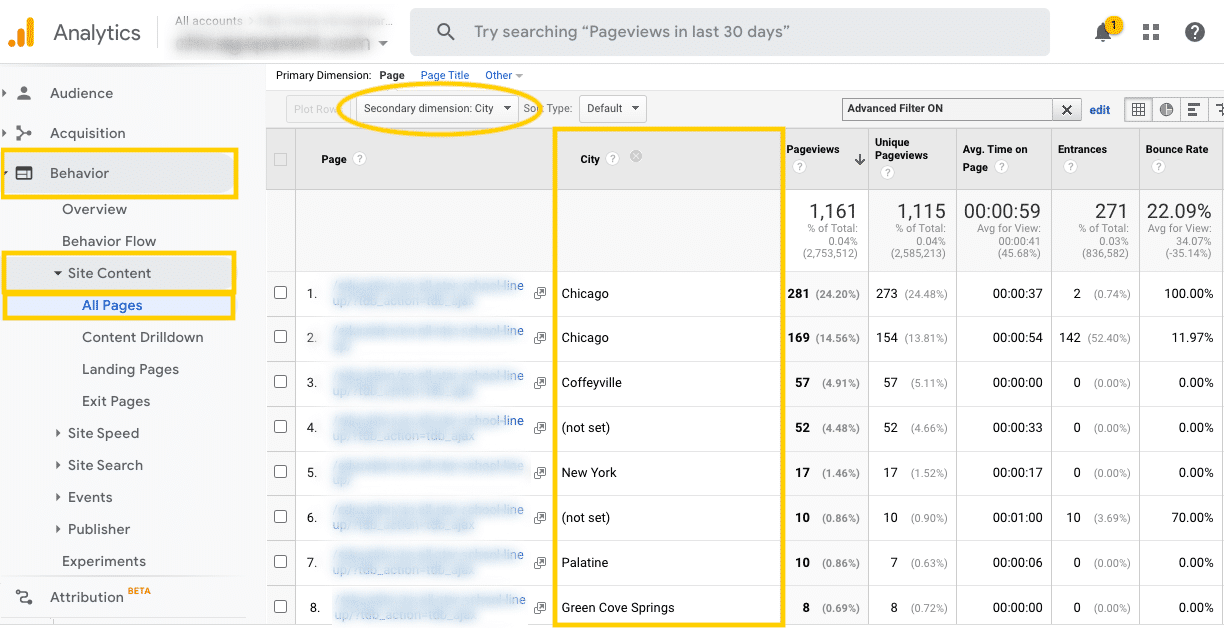
Finally, learn where your article traffic is coming from — where these viewers live. Again, Google Analytics does this work for you. In the same "Behavior" section you've been in, head back to the "Secondary Dimensions" dropdown and type in/select "City" to display this:

3 Google Analytics City

That second column illustrates where your audience is. They should be in the regions you've targeted in your paid and organic content promotions. Or, if you've cast a wider net, you'll get a flavor of which cities are responding best to your content.

A couple of curveballs to watch for

Naturally, there are ways your metrics can go a bit sideways. Keep your expectations in check by keeping these factors in mind.

1. Be level-headed about clicks

Remember, clicks aren't the outright goal of sponsored articles. Click-through rates, or CTRs, can be four times higher vs. display ads; however, they still average around 0.6%.

While that may seem small, put it in this context:

  • Sponsored content builds your credibility as a trusted, expert source. This process can take time. That means folks might need to read a few of your articles before clicking.

  • When clicks do happen, quality and intent tends to be far higher than that of traditional display ads. After reading your article, viewers are more likely to want to learn more about you.

2. Be cautiously excited about going 'viral'

Let's say one of your articles goes viral and hits that 5,000+ mark. Amazing, right? Well, it depends. Sometimes you've stumbled on a fantastic keyword that people are really searching for on Google.

But ... what if you're a regional company trying to reach the Chicago or metro Detroit markets, for instance? That extra out-of-state traffic might not directly help you. Still, it'll help build your trustworthiness and clout as an expert in your space.

Next steps to tracking sponsored content metrics

Knowing what to track and why it matters is essential. And now, you know what metrics best illustrate your sponsored content article's success — and where to find those numbers.

Once you get cozier with Google Analytics, create a tracking system to see how your sponsored articles are performing. From there, hone in on which topics and promotional sources are doing the best — and invest more in both.

And if you're looking for a little boost, get a sense of how much sponsored content costs when you pair up with a publisher partner like Zoe Marketing & Communications.

Remember, sponsored content articles are workhorses for building trust with your brand. Focus on the right metrics, and you'll see how that trust grows!

Ready to Reach More Customers?

Connect with your best prospects — and drive more conversions — with a custom mix of digital ads, content, email, streaming ads, SEO, creative services and more.

View Zoe's Services

Eric Gerber

Eric Gerber delivers a deep understanding of data, performance and marketing tactics as an analyst and consultant for Zoe Marketing & Communications. A driven learner, his marketing experience spans from real estate to women's hair extensions.