March 21st, 2024 | 3 min. read
By Kim Kovelle
Discover 4 key types of Digital Ads for your business with the free guide.


Google Ads is a potent search engine marketing (SEM) method — and it’s also a daunting one. For every click, you’re typically paying at least a dollar. It can add up. But is it working?
Google Ads is a potent search engine marketing (SEM) method — and it’s also a daunting one. For every click, you’re typically paying at least a dollar. It can add up. But is it working?
That’s where average Google Ads metrics come into play. These benchmarks vary by industry and clearly show whether your SEM is on track or needs recalibrating.
We’ve pinpointed 10 common industries and highlighted key metrics for each one, thanks to the latest from industry data leaders Databoxa and Store Growers.
- Cost per click (CPC) benchmarks
- Conversion rate (CR) benchmarks
- Cost per action (CPA) benchmarks
- Click-through rate (CTR) benchmarks
- Quality score (QS) guidelines
Get a clean snapshot of what to expect — and feel empowered to make informed adjustments.
Download Your Digital Ads Guide
Learn how digital ads can help your business, including the tools, techniques and strategies to create successful campaigns.
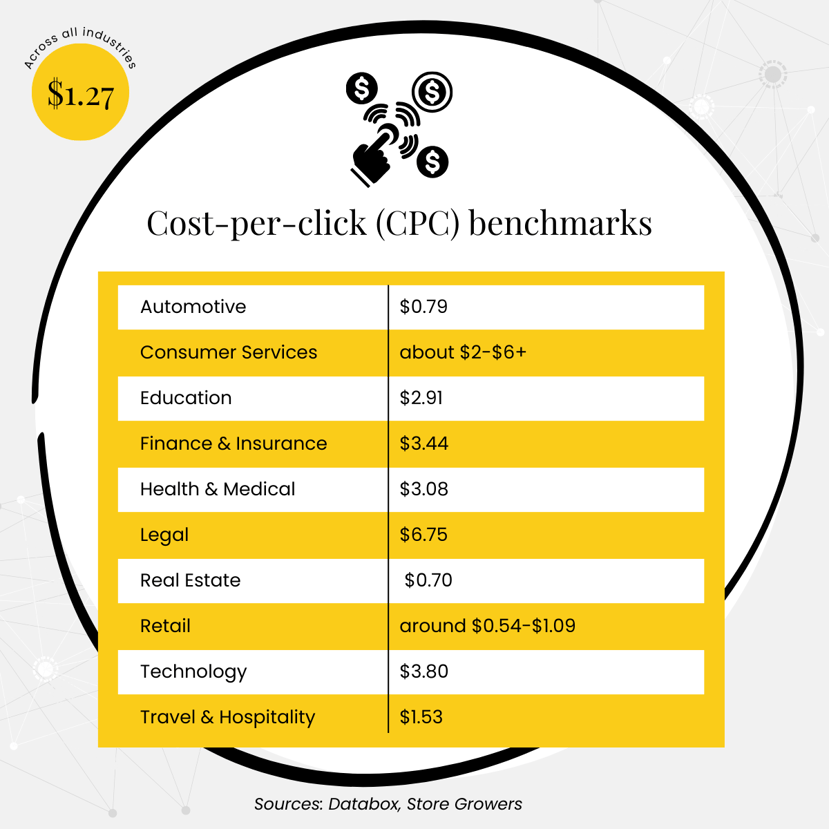
Cost-per-click (CPC) benchmarks
CPC is what you’ll pay for each click on your ad, which is why this SEM tactic is also known as pay-per-click or PPC. It’s crucial for figuring out your budget and cost-effectiveness.
Across the board, the average Google Ads CPC for all industries is $1.27, Databox notes.
A lower CPC stretches your money to get more clicks and potential conversions.
-
Automotive: $0.79
-
Consumer Services: about $2-$6+
-
Education: $2.91
-
Finance & Insurance: $3.44
-
Health & Medical: $3.08
-
Legal: $6.75
-
Real Estate: $0.70
-
Retail: around $0.54-$1.09
-
Technology: $3.80
-
Travel & Hospitality: $1.53
Conversion rate (CR) benchmarks
CR measures how many clicks on your ads result in a desired “conversion” or result, like a sale or a sign-up. This metric determines how well your campaign is driving results.
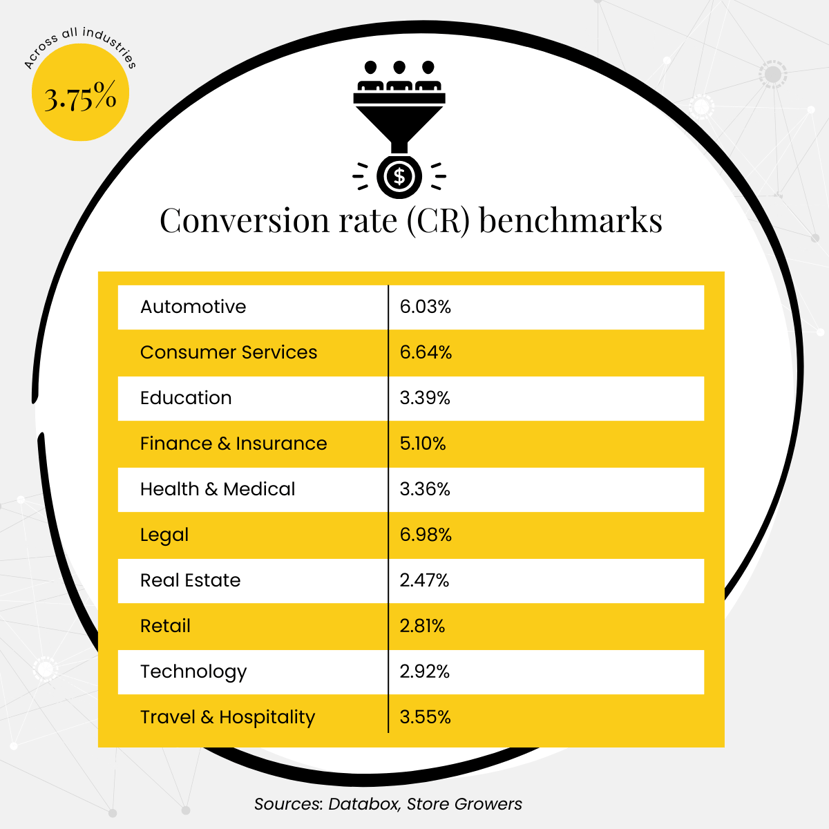
Google Ads conversion rates average 3.75%, Store Growers notes, but varies “wildly” by industry.
Here, a higher number is better — it shows more of your audience is converting.
-
Automotive: 6.03%
-
Consumer Services: 6.64%
-
Education: 3.39%
-
Finance & Insurance: 5.10%
-
Health & Medical: 3.36%
-
Legal: 6.98%
-
Real Estate: 2.47%
-
Retail: about 2.81%
-
Technology: 2.92%
-
Travel & Hospitality: 3.55%
Cost-per-action (CPA) benchmarks
CPA is what you pay for each person who completes your desired action, like a purchase or registration. Lower CPAs are better, of course, and mean you’re getting more for your money.
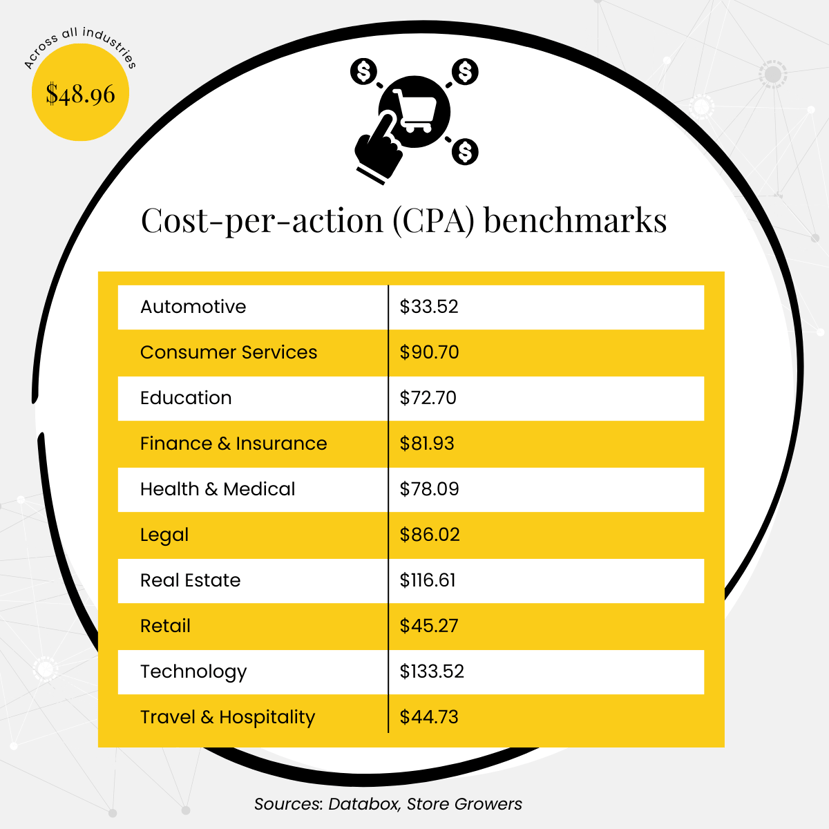
All industries considered, the cost-per-action evens out to $48.96, Store Growers says.
The payoff is commonly 5:1 — so, for every $1 you invest in marketing, you’ll make $5.
-
Automotive: $33.52
-
Consumer Services: $90.70
-
Education: $72.70
-
Finance & Insurance: $81.93
-
Health & Medical: $78.09
-
Legal: $86.02
-
Real Estate: $116.61
-
Retail: about $45.27
-
Technology: $133.52
-
Travel & Hospitality: $44.73
Click-through rate (CTR) benchmarks
CTR is a bit of math: It’s the number of people who click your ad divided by the number who view it (i.e., impressions). It’s an essential measurement of how well your ads grab attention.
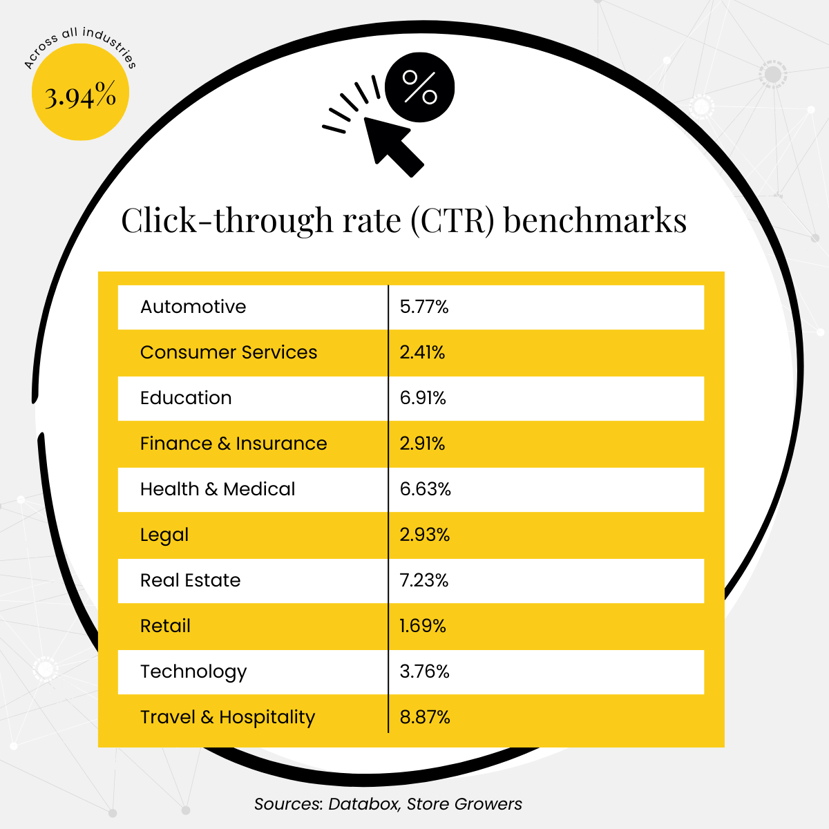
A good click-through rate across all industries is 3.94%, reports Databox.
The higher your CTR, the better the odds your ad content is strong and your targeting is effective.
- Automotive: 5.77%
- Consumer Services: 2.41%
- Education: 6.91%
- Finance & Insurance: 2.91%
- Health & Medical: 6.63%
- Legal: 2.93%
- Real Estate: 7.23%
- Retail: about 1.69%
- Technology: 3.76%
- Travel & Hospitality: 8.87%
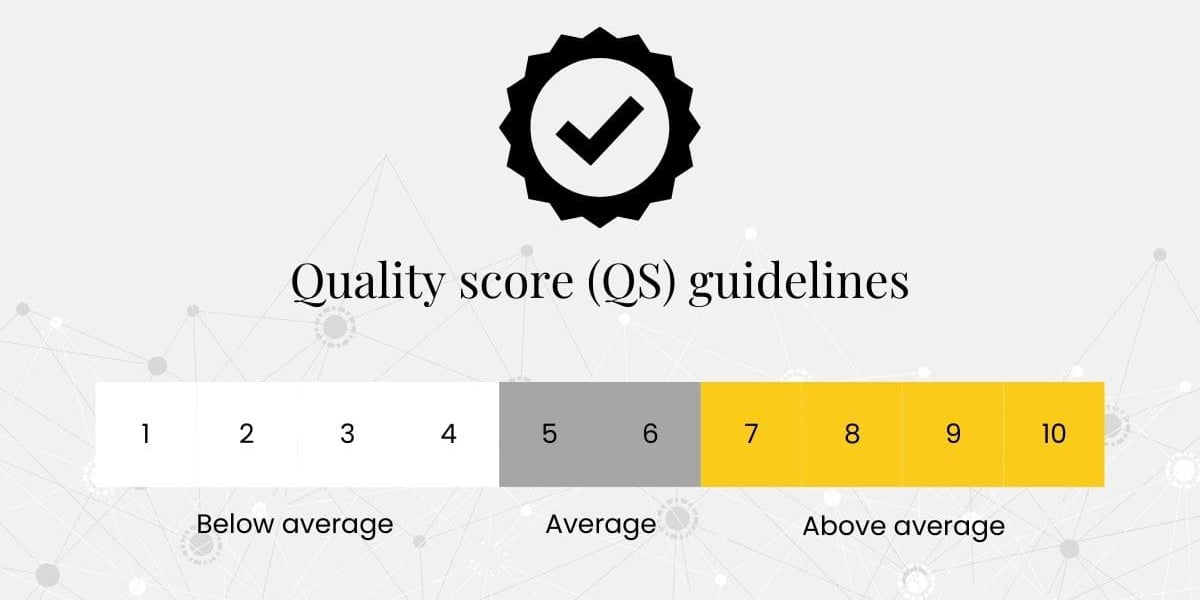
Quality score (QS) guidelines
Last but not least, the QS is a Google Ads metric that tracks the quality and relevance of your ads and the keywords you’re targeting. It ranges from 1 to 10, with 10 being the best score.
Your QS is affected by things like CTR, the relevance of each keyword to its ad group, and landing page experience.
A higher score is a significant credibility boost from Google, too.
-
Above average is 7-10
-
Average is 5-6
-
Below average is 0-4
Next steps in achieving success with Google Ads
Running Google Ads can feel overwhelming, but clear performance benchmarks can help you stay grounded.
Looking for more help with your Google Ads metrics, or even designing and running campaigns? Talk to us. Zoe Marketing & Communications can explain what will work best for your unique industry niche.
And to improve your current SEM, check out some helpful examples of:

Download Your Digital Ads Guide
Learn how digital ads can help your business, including the tools, techniques and strategies to create successful campaigns.
Topics: